

Four levers are moving at the same time: remit and timing, competency mix, sourcing model and strategic market focus. Patching job descriptions closes none of them, which is why the constraint is usually the operating model rather than recruitment. The key takeaways below summarize the argument. The evidence, the Access Lag Framework and an eight-question diagnostic for your own function follow.
“If your operating model has not been redesigned in the last two years, it is still organized for 2024.”
Key takeaways
- Access is getting harder in every major region. In Europe, 49% of recently approved medicines are not available to patients at all34. In Japan, 86 medicines already approved in the US or Europe had not even entered the country40. In China, a place on the national reimbursement list costs an average price cut of more than 60%29.
- And the US has become complicated too. Under Most-Favored-Nation policy one product can carry several US prices at the same time: a Medicaid price, a negotiated Medicare price, a commercial net price and a cash price on a federal website31, 41.
- The function is adapting more slowly than its environment. Role profiles trail the external agenda by one to two years. The competency literature shows the same direction driver by driver: 13 months for JCA, over three years for AI, and MFN not yet absorbed at all.
- Four levers are moving simultaneously. Remit & timing, competency mix, sourcing model and strategic market focus. Patching job descriptions closes none of them.
- Offshore market access work is not simply moving onshore. AI absorbs the standardized production layer, and what remains onshore and nearshore gets smaller in scope but more senior in judgment.
- The constraint is usually the operating model, not recruitment. When two or more levers are moving at once, hiring against current job descriptions reproduces the lag instead of closing it.
- What to do about it. Assess the four levers together, not one at a time, and rewrite role profiles against where policy and evidence demand will be in two years rather than where they were at the last reorganization.
Evidence base: 62 market access vacancies coded against a competency framework, 33 of them on full requirement text; ISPOR Europe and World EPA Congress programs coded by session theme, 2019 to 2026; and the professional competency literature. Full method and limitations in the technical appendix.
Access is getting harder. The function is adapting more slowly.
Our point of view starts in Europe, because Europe measures itself best. The US, Japan and China show the same direction of travel, for different reasons, and this section takes them in that order.
Europe’s access record has been getting worse for years, and the 2026 data does not break the pattern. EFPIA’s W.A.I.T. study covers 168 medicines that were approved centrally between 2021 and 2024, each for the whole European Union at once. The median time from approval to availability is 532 days, ranging from 56 days in Germany to 1,201 days in Romania34. Averaged across European countries, 49% of those medicines are not available to patients at all, against 46% in 2019. Measured against all 168, the share with full reimbursement fell from 42% in 2019 to 28% in 2025, while the share available only under restrictions rose from 6% to 17%34. The waiting time is only half the story. What patients get at the end of it has changed as well.
And some launches no longer happen. The industry’s own access-hurdles database covers 91 recently approved products across 30 European countries. On average 61% have been filed for pricing and reimbursement, which leaves 39% not filed at all. Part of that is timing rather than a final decision, since the products are on average 27 months past approval. But of the reasons companies give for not filing, the largest group is economic: too few patients, no local presence or launch costs that cannot be recovered39.
The US has become difficult in another way. The problem there has never been whether a medicine is available. It is the price, and there are now several of them. Manufacturers that signed Most-Favored-Nation agreements committed to matching the lowest price paid in comparable countries, including on products they have not launched yet. A federal cash-price website, TrumpRx, opened on 5 February 2026. In December 2025 the Centers for Medicare & Medicaid Services proposed two further Medicare models, GLOBE for Part B and GUARD for Part D, which would apply the same benchmark to rebates; GLOBE was finalized on 30 September 2026, while GUARD had not been finalized when this article went to press.
Update, 27 October 2026 (not part of the PDF). The GLOBE final rule was published in the Federal Register on 2 October 2026. It is narrower in scope than the December 2025 proposal, and the model start date moved from 1 October 2026 to 1 January 2027. A legal challenge to GLOBE was filed in the US District Court for the District of Columbia on 7 October. As of mid-October the GUARD final rule was still under review at the Office of Management and Budget (Gibson Dunn, 14 October 2026).
An executive order of April 2026 linked relief from pharmaceutical tariffs to signing an MFN agreement41. One product can now sit at a Medicaid price, a negotiated Medicare price, a commercial net price and a cash price at once, each with its own rules41.
Japan and China show the same pressure in other forms. Japan’s regulator counts 86 medicines that were approved in the US or Europe and for which development in Japan had not even started; industry figures put it at 82 a year later. For products from smaller biotech companies the gap is wider: of 98 such medicines approved in the US between 2019 and 2023, 52% had neither been approved nor entered development in Japan, against 19% in Europe40. China grants a place on its national list only against steep price cuts, which is why a separate commercial route has opened alongside it; Lever 4 sets out both29.
The causes are mixed, and most of them sit outside any single company. In Europe, EFPIA points to regulatory timelines, evidence requirements that do not line up and Member State budgets34. In Japan the binding constraint is the cost of running a local development program under national trial requirements40. In the US it is policy design rather than availability41. We do not read these numbers as a report card for the market access function, and this article does not claim the function is failing. They describe the conditions it now works in.
Those conditions have changed on four fronts at once:
- Health Technology Assessment (HTA) reform, with the EU the sharpest case. The Regulation became applicable in January 2025. Joint Clinical Assessment and Joint Scientific Consultation move the clinical evidence question to European level and require access and HEOR input when the pivotal trial is designed, not after approval9, 10.
- US Most-Favored-Nation pricing. Since May 2025 US prices have been tied to a basket of other developed markets, most of them European, so a price agreed in Europe is no longer only a European matter13, 14. It has also made the US itself harder to work in, for the reasons set out above.
- Payer evidence demand across the lifecycle. Immature data at launch, conditional reimbursement and outcomes-based agreements have turned evidence into a lifecycle commitment rather than a submission milestone12, 17, 27.
- AI. Generative AI moved from novelty to baseline office skill in under three years, and is now absorbing the standardized production layer of modeling, evidence synthesis and dossier work2, 5, 24.
Each of these changes what the function has to do, when it has to do it and who needs to be in the room. All four are well known by now. The harder question is how quickly role profiles, competencies and structures are following. Two observations from our own vacancy research give a first indication.
A Parexel posting in our July 2026 sample for a senior pricing and market access associate lists ChatGPT and Copilot alongside Excel and PowerPoint24. Generative AI is now an entry-level office skill in market access.
Pricing policy tells a different story. The May 2025 US Executive Order made Most-Favored-Nation (MFN) pricing the dominant theme at this year’s pricing congresses. Fourteen months on, in our July 2026 sample, not one of 33 postings across access, Health Economics and Outcomes Research (HEOR) and pricing names MFN13, 24. On the specialist health economics job board (roughly 370 to 430 live roles), 56 carry an explicit AI, machine learning (ML) or large language model (LLM) tag as of July 2026, about one in seven, and AI now sits in the board’s filter menu alongside Excel, R and Python24.
Set side by side, these two observations give us a measurement: market access role profiles trail the policy agenda by one to two years. If your operating model has not been redesigned in the last two years, it is still organized for 2024.
It’s fair to press on that claim. Job descriptions rarely name a specific law or policy: nobody advertises for “MFN expertise” any more than for “Germany expertise”, even though Germany remains one of Europe’s most important reimbursement markets. Companies hire for capabilities, such as pricing strategy, payer engagement and policy monitoring, and expect the specific policy knowledge to follow. So the MFN silence alone doesn’t prove a lag; we treat it as one illustration, not the whole case. The stronger evidence sits in three structural shifts. Market access moving earlier into development under the EU’s HTA reforms, specifically due to its Joint Clinical Assessment (JCA) and Joint Scientific Consultation (JSC) requirements. The function is integrating access, HEOR and pricing. And AI and offshoring are shifting onshore work from production toward orchestration, judgment and stakeholder management. Levers 1 to 3 below set out that evidence in full.
That lag would matter less if it were one skill to add. It is not. All four levers of the market access operating model are moving at the same time:
- Remit & Timing: the function is pulled earlier into development and its scope is broadening.
- Competency mix: required skills are moving toward data-and-AI fluency, the new EU HTA regime and cross-functional integration.
- Sourcing model: the onshore, nearshore, offshore, external-vendor and AI-supported balance of where and how work gets done is being redrawn.
- Strategic market focus: companies are reprioritizing toward China and other emerging markets, and need to manage lower price levels without undermining global reference pricing.
Each shift lands on the operating model. Patching job descriptions closes none of them.
At Vintura, these four levers show up as four recurring gaps across our life-sciences clients: Ownership, competencies, sourcing and strategic prioritization. Our redesign closes them together, not one at a time.
What is a market access operating model?
It describes how a pharmaceutical organization structures accountability, capabilities, sourcing and strategic focus across access, HEOR and pricing so decisions get made by the right people, at the right time, in the right place and in the right markets. It answers four questions: what access owns and when do they get involved (remit & timing); what capabilities does the function need (competency mix); where and how is the work done (sourcing model: onshore, nearshore, offshore, external vendors or AI-supported); and where does the organization compete hardest (strategic market focus).
This article sets out the evidence for all four levers, introduces the Access Lag Framework we use to diagnose and close the gap, and ends with an eight-question test for your own function.
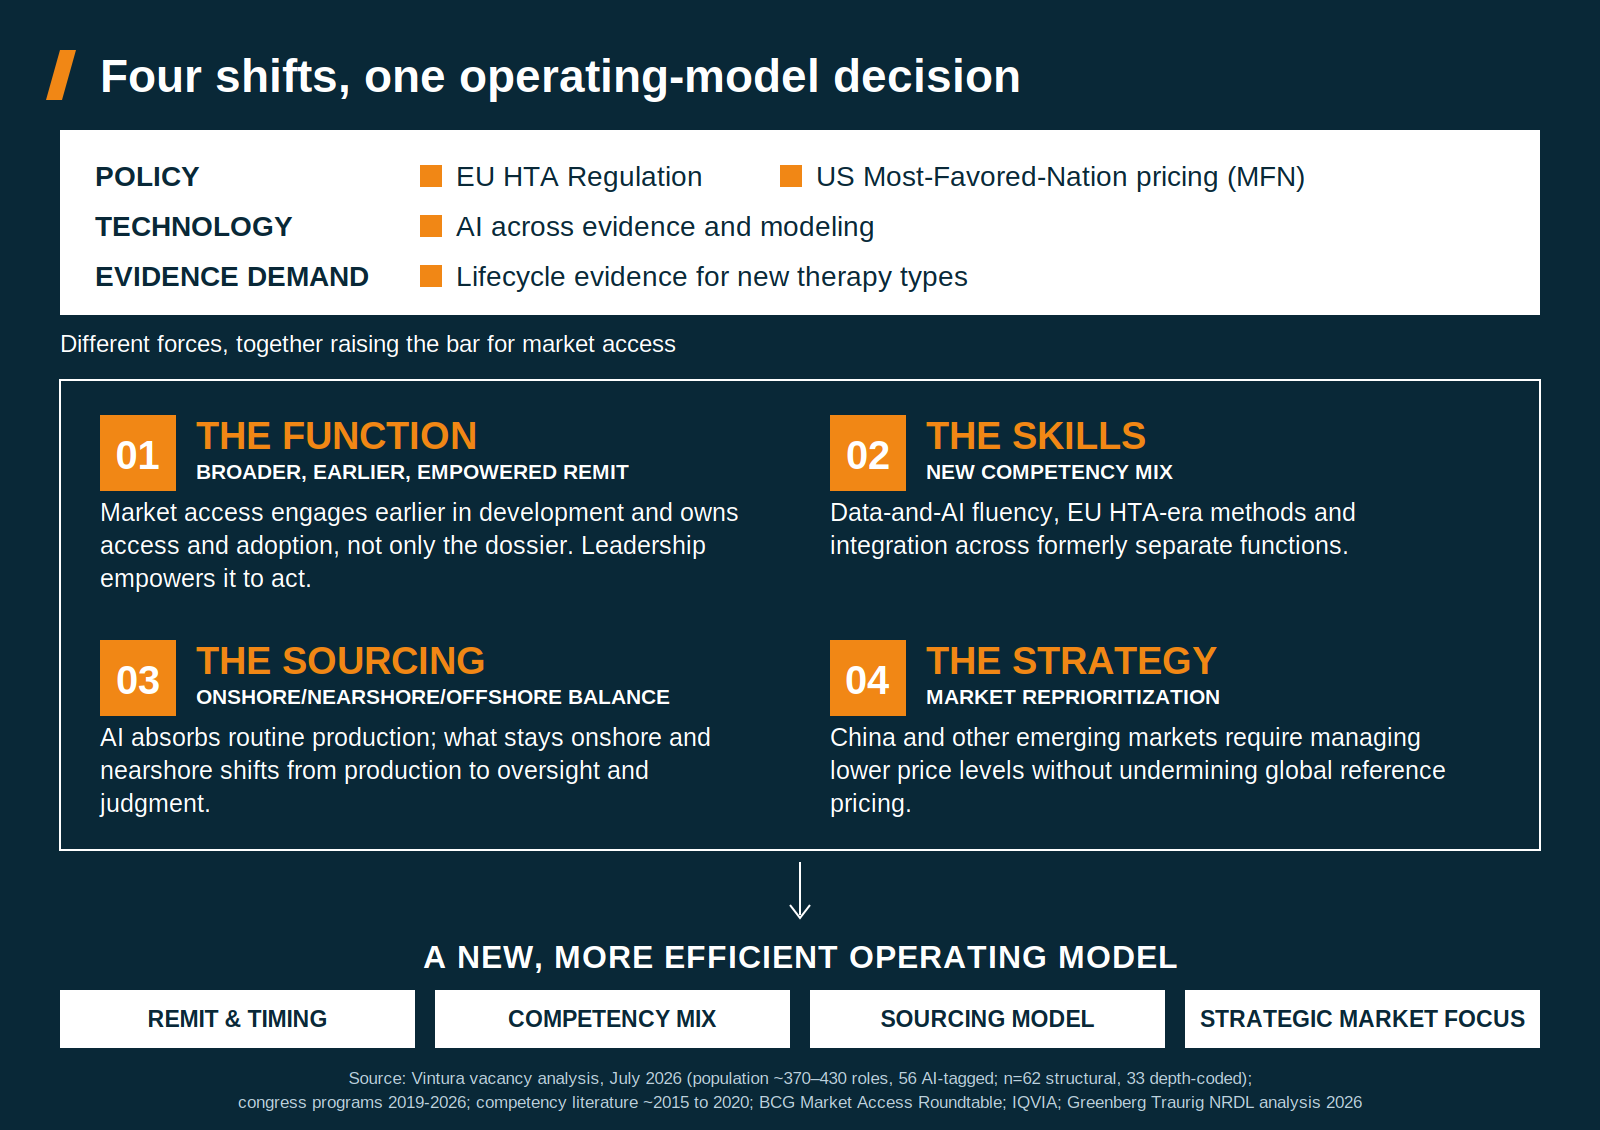
Introducing the Access Lag Framework
We call this finding, and its fix, the Access Lag Framework. It has two parts, and this article uses both throughout.
The Access Lag Diagnostic measures how far a function’s remit, competencies, sourcing and strategic focus trail the external policy and technology agenda: the one-to-two-year gap this article documents from vacancy data, congress programs and the competency literature.
The lag is not uniform. Dating each external policy and technology event against the point at which the professional competency literature first named the matching competency gives a range rather than a single figure. The EU HTA Regulation became applicable in January 2025 and ISPOR named JCA competencies 13 months later2, 9. Generative AI entered general professional use in late 2022 and the same literature named data-centric competencies, including AI, as its central change three years and three months later1, 2. MFN was signed in May 2025 and no competency framework had named MFN implication knowledge fifteen months on13.
Regulatory drivers are absorbed faster than technological ones. A regulation arrives with a date attached, so the field can prepare against it. A capability shift has no commencement date, so it is recognized only once it is already embedded. That is why the AI gap is the widest of the three, and why AI is the lever where hiring against last year’s job description costs the most. The figures above track when each driver entered the professional competency literature. The one-to-two-year lag this article cites for role profiles is a separate measurement, taken from vacancy text. The two describe different things and should not be combined.
The Four Levers close that gap by redesigning the operating model on the variables Figure 1 shows converging: Remit & Timing, Competency Mix, Sourcing Model and Strategic Market Focus, with efficiency running through all four. Sections 1 to 4 below evidence each lever. Section 5 turns the framework into a redesign and makes the efficiency case explicit. Section 6 gives you an eight-question diagnostic to score your own function.
1. Lever 1: Remit & Timing, the function earlier and broader
When should market access get involved in development? Earlier than most operating models assume: the evidence below points to trial design as the entry point, not launch planning.
The market access function is being pulled earlier into development, and it owns more once it’s there. Both changes are documented, and both preceded any individual skill change.
Earlier. Around 2018, payer input was typically first sought around Phase 323, 36. By the mid-2020s, early involvement is a requirement, not a trend: Deloitte’s research concludes that launch preparation should start much earlier, with market access built in from the outset21. The EU HTA regime has hard-wired this. JSC and PICO (population, intervention, comparator, outcome) planning under the JCA require access and HEOR input when the pivotal trial is designed, not after approval9, 10.
One caveat matters. Senior practitioners say the same thing: market access should be involved earlier, yet in practice the function is still often treated as downstream and reactive22. The shift is agreed in principle and unfinished in execution, which is exactly where operating-model redesign belongs.
This is where the function has room to act. Conditional reimbursement is granted against evidence commitments, re-assessment triggers and managed-entry terms. All three are settled by trial design and evidence planning, years before a dossier is filed. The same goes for the launches that never happen: whether a market pays back depends on the price architecture, the evidence package and the local footprint the company has built for it29. None of these figures measure the market access function, and we do not read them that way. The part a company does control is set at operating model level.
2018: Payer input was typically first sought around Phase 3.
2026: Joint Scientific Consultations put access at the table when the pivotal trial is designed.
One study puts an organizational variable in the frame. Across seven European countries and 35 new anticancer medicines, the factors associated with faster reimbursement were national GDP, the absence of a pre-assessment procedure and submission by a large pharmaceutical company35. Measured clinical benefit, scored on the ESMO magnitude of clinical benefit scale, was included as a candidate factor and was not among them. Company size is a crude proxy and the authors claim no causation. But it is the one signal in this literature that organizational characteristics track access outcomes, and it points at capability rather than at the molecule.
Someone absorbs the lag. A function running one to two years behind the external agenda does not carry that gap on its own. It surfaces as evidence planned too late to answer the question a payer actually asked, as a dossier that clears the bar for restricted access rather than full reimbursement, and as months added before treatment starts. For the organization the lag is a slower launch. For the patient it is a longer wait.
Broader. The Boston Consulting Group (BCG) Market Access Roundtable has benchmarked the function every three years since 2013. Its 2022 benchmark, the fourth in that series (14 companies, over 150 interviews, roughly 500 survey responses), concludes market access has moved from a technical launch requirement to a business-critical priority on the senior-management agenda18. The remit now extends beyond reimbursement to securing patient access and adoption, with goals set at executive level19. Leadership competencies have grown to match: enterprise-wide strategy, system-wide policy fluency, and what the Roundtable calls leadership without authority18, 20. Vacancy text confirms it: single roles now own access strategy, pricing, HEOR and policy together24.
Empowered. Earlier and broader are worth little without the authority to act on them. A seat at the trial-design table is not the same as a vote at it, and what decides the difference is usually not the organization design but the incentives running underneath it. Functions are measured on different things: regulatory performance is judged on approvals secured and timelines met, market access on reimbursement and access outcomes that land years later. Where a JCA-driven change to the evidence plan reads to regulatory colleagues as added risk to an approval they are accountable for, they will push back, and they are behaving rationally when they do. Cost carries the same asymmetry. Different evidence-generation designs carry materially different budgets, and the two functions justify that spend on different grounds and over different time horizons.
Joint Scientific Consultation is where this currently bites hardest. Companies weigh asking for JSC advice against staying on the established path of European Medicines Agency (EMA) scientific advice alone, and the deciding factor is often not methodological. It is that the downside of the newer route is attributable and the downside of the familiar one is not: if an approval slips, someone can be asked why the company added a step; if a JCA lands badly, no one can show that different advice would have changed it. The counterfactual is unavailable in both directions, which is exactly why the decision migrates upward to whoever is willing to own it.
That makes adjudication a leadership task rather than a process one. A disagreement between two functions measured on different outcomes cannot be settled by the more junior of the two, and should not be settled by whichever escalates more persistently. Three things need to be explicit in the operating model: who decides when medical or regulatory and access requirements conflict, on what basis and by when; what each function is measured on, and whether those measures pull in compatible directions; and where the cost of a more demanding evidence package sits, so that it is not charged by default to the function least able to defend it. Without that, an earlier seat produces earlier friction rather than better evidence.
How this closes the Access Lag:
- Market access needs a formal seat at trial-design decisions, not just at launch planning.
- Name who adjudicates when access and medical or regulatory requirements conflict, and check that functional incentives support that decision rather than quietly reverse it.
- “Remit” and “timing” are operating-model variables: they belong in your organization design, not your training plan.
- If access still receives the evidence package after the fact, Lever 1 is your starting point.
2. Lever 2: Competency Mix, a new center of gravity
What competencies does market access need now? The technical base of five years ago is necessary but no longer sufficient, in every domain. HEOR, access and pricing are all converging on the same competency core: AI-and-data fluency, JCA-era methods and the ability to work across domains rather than within one.
Within that widening remit, required competencies are moving in one direction across access, HEOR and pricing. Two evidence streams agree: current job postings show what employers ask for now, and the competency literature shows how the field’s consensus has shifted over the last five to ten years. Full method is in the technical appendix.
Five forces reshaping the market access operating model:
- Data science and AI
- EU HTA and the JCA
- Pricing-policy shocks (MFN, IRA)
- Evidence intensity across the product lifecycle
- Role integration and offshoring
1. Data science and AI.
ISPOR, the International Society for Pharmacoeconomics and Outcomes Research, is the clearest marker. Its 2020 framework had no AI domain, with Real-World Evidence (RWE) folded into general methods1; the February 2026 update names data-centric competencies (statistics, analytics, RWE and AI) as the central change2. AI has since moved from third to first in ISPOR’s Top 10 HEOR Trends report, ahead of RWE and drug pricing, though human oversight remains essential5. Demand matches supply: 56 roles on the specialist job board, about one in seven, carry an explicit AI, ML or LLM tag24.
2. EU HTA and the JCA.
The Joint Clinical Assessment, phasing in from January 2025 with oncology medicines and advanced therapy medicinal products (ATMPs) and reaching all centrally authorized medicines by 2030, introduced a competency set absent from the 2020 literature. The biggest change is running regulatory and HTA workstreams in parallel rather than in sequence, alongside PICO scoping and simulation; indirect treatment comparison and its statistics matter too, but they are a smaller part of the shift9, 10. HTA advisers call the parallel-working requirement new, breaking the traditional silo between regulatory, statistics, medical, HEOR, access and pricing7, 8.
3. Pricing-policy shocks.
Two dated events reshaped pricing competencies. The US MFN Executive Order of 12 May 202513 was followed within days by price targets from the US Department of Health and Human Services (HHS)14, and thereafter by a run of manufacturer agreements that reached 17 by April 2026, covering every manufacturer that received a letter in July 2025, alongside a Medicaid payment model15, 31. The first negotiated Medicare maximum fair prices under the Inflation Reduction Act (IRA) also take effect from 2026, with the program continuing16. And outcomes-based contracting has moved from pilot to practice: the Centers for Medicare & Medicaid Services (CMS) Cell and Gene Therapy Access Model saw outcomes-based agreements negotiated with the two sickle-cell gene-therapy manufacturers in late 2024, states joining from January 202517. These agreements need statistical risk modeling and lifecycle monitoring, not a single launch-price decision.
4. Evidence intensity across the lifecycle.
The product mix is raising the evidence bar before, at and after launch. Cell and gene therapies and accelerated approvals reach payers on immature data, so payers demand further evidence post-launch or restrict access27. Shorter trial data raises the need for RWE to validate outcomes at the reimbursement decision26, and the EMA’s latest report on its own regulator-led studies counted 88 real-world data studies completed or ongoing between February 2025 and February 2026, 49% more than the year before42. Outcomes-based and managed-entry agreements are now the standard launch response to uncertainty, and HTA bodies increasingly revisit decisions post-launch12, with integrated evidence planning now budgeting for post-launch studies25. RWE sits at the center of this6. In most organizations it is positioned in medical rather than in market access, but the evidence it produces is what reimbursement, re-assessment and managed-entry decisions now turn on. That makes the interface, not the reporting line, the design question: market access needs at least a close and deliberate connection to RWE, with shared evidence planning and clear hand-offs, whichever function owns it.
5. Role integration and offshoring.
Both evidence streams show scope consolidation: single roles now combine access strategy, pricing, HEOR/HTA and policy, where three or four departments once sat separately. Meanwhile the HEOR production layer (modeling, evidence synthesis, scientific writing) has been relocating to lower-cost hubs. Section 3 covers where this pattern goes next, and why we think the direction is turning.
Domain by domain
Access (reimbursement, value communication and policy shaping).
In 2020, this centered on national HTA submission, dossier development, payer value communication and negotiation, run sequentially after approval, country by country1. Two changes stand out today. First, the JCA added a competency set that was absent five years ago7, 9, 10: running regulatory and HTA workstreams in parallel is the biggest addition, alongside PICO scoping and simulation and EU coordination, with indirect treatment comparison a smaller part of the shift. Second, vacancy data shows consolidation into single roles owning strategy, pricing, HEOR/HTA and policy together: a Novartis role spanning access, pricing, contracting, HEOR and policy; a Moderna VP owning global access, pricing and HEOR; a Boston Scientific lead spanning public affairs, HEOR and access24. Value communication and policy shaping both run through these changes rather than sitting apart from them: translating evidence into a payer-ready value story is one half of the role, and engaging with HTA bodies and policymakers to help shape the frameworks access decisions get made under is the other.
2020: Three or four adjacent departments: access, pricing, HEOR, policy.
2026: One integrated role that owns all four.
HEOR
In 2020, ISPOR defined HEOR through economic evaluation, methods, HTA, clinical outcomes and epidemiology, with no AI domain1. Today, AI and machine learning are explicit duties in senior HEOR and HTA-statistics roles, such as a J&J Director of HTA Statistics and RWE Methods role that names building AI/ML analytics platforms as a core duty24, and the 2026 ISPOR framework confirms this at field level2. The shift is upward: onshore HEOR adds AI oversight and HTA judgment, while AI increasingly handles first-draft production.
2020: The role built the model.
2026: The role specifies, audits and defends a model AI helped produce.
Pricing
The classic 2018 set centered on list-to-net management, payer negotiation, contracting and lifecycle pricing, sized at roughly five to six full-time equivalents (FTEs) per €100 million of national revenue11. Today it’s broadening: deeper health economics, data science, dynamic contracting and local policy navigation now sit on top of the negotiation base12, and outcomes-based agreements require statistical risk modeling and lifecycle monitoring17. Policy literacy has risen sharply with IRA maximum fair prices and MFN13, 16, and increasingly the competency that matters is MFN implication knowledge: not the ability to name the Executive Order, but to translate its reference-pricing mechanic into value-demonstration strategy, strategic access decisions and pricing architecture across markets. And here is the lag this article opened with: generative AI is now a baseline pricing skill, while none of the 33 postings in our July 2026 sample names MFN24.
2020: Negotiate the net price at launch.
2026: Model, negotiate and monitor outcomes-based agreements across the lifecycle, under MFN and IRA constraints.
Competency shift at a glance
| Domain | Center of gravity, ~2020 | Center of gravity, 2026 | Primary force |
|---|---|---|---|
| HEOR | Economic evaluation, HTA methods, statistics | Same core, plus AI/ML oversight, strategic direction and integration | Data science and AI |
| Access | National HTA submission, dossier, value communication, policy shaping, sequential negotiation | Adds JCA/PICO, parallel working, EU coordination; consolidates strategy, pricing, HEOR, policy | EU HTA/JCA plus integration |
| Pricing | List-to-net negotiation, contracting, lifecycle pricing | Adds health economics, data science, dynamic/value-based contracting, MFN/IRA literacy | Pricing-policy shocks |
How this closes the Access Lag:
- The technical base of five years ago is necessary but no longer sufficient in every domain.
- AI fluency, JCA-era methods and cross-domain integration are now baseline competencies, not specialties.
- Map your function’s competency mix against the table above before you write your next job description.
- Build MFN implication knowledge explicitly: the ability to connect a pricing-policy shock to value demonstration, strategic access decisions and pricing, not just awareness that the policy exists. It won’t show up as a named line in a job description, but it comes up again and again in the work itself.
3. Lever 3: Sourcing Model, the onshore, nearshore and offshore balance
Should market access work be onshored, nearshored or offshored? Our reading: we don’t expect a wholesale move of work from offshore to onshore and nearshore. We expect AI to absorb the standardized production offshore hubs were built to deliver, directly shrinking that layer, while the competencies required onshore and nearshore shift toward oversight, judgment and AI management rather than production.
This lever is not about outsourcing versus insourcing. It is about where, inside a company’s own global footprint, work sits, and how that balance is shifting.
Current vacancy data confirms real offshore production today: HEOR modeling, evidence synthesis and scientific writing roles sit in hubs like Hyderabad, while strategy-titled roles stay in Europe and the US24. That is the well-evidenced, present-tense finding. What comes next is our own forward-looking read of the trend: AI absorbs that production directly, and the offshore layer shrinks because of it.
Why we expect this. AI increasingly handles model builds, first-draft literature synthesis, dossiers and medical writing, exactly the standardized production work offshore hubs were built to deliver at volume and low cost. As AI takes on more of that work directly, the offshore layer built around it has less to do, while the roles that remain onshore and nearshore shift toward judgment, payer relationships and AI oversight.
Onshore, nearshore and offshore: what do we mean?
Onshore is a role based in the same region as headquarters and key markets (Western Europe, the US). Nearshore is a role in a lower-cost but geographically and culturally close location, with strong time-zone overlap and easy oversight. Offshore is a role in a distant, much lower-cost hub, an India-type hub, built for scale and standardized production at the cost of time-zone and cultural distance.
The counter-case, and why we think it is about vehicles rather than places.
The strongest argument against this reading is that pharma’s offshore capacity is growing, not shrinking. Captive capability centers in India have expanded their pharma commercial services roughly two and a half times over five years, and portfolio analytics, forecasting, pricing strategy and HEOR are all named as areas set to take deeper ownership there32. One large manufacturer raised planned headroom at a single Indian site from about 2,600 to about 4,500 people in early 2026, with AI among the named capabilities33. On the face of it that contradicts everything above.
The same logic is visible in business services generally, where the largest providers are repositioning away from selling labor capacity. In October 2025 Capgemini completed a $3.3 billion acquisition of the business-process provider WNS and framed it as a deliberate move from traditional business process services toward AI-run operations30.
We think both things are true because two different models are being described. The vendor arbitrage model sells headcount to do repetitive work, and it is contracting: the largest players are repositioning away from labor-based process delivery toward AI-run operations30. The captive capability center builds owned capability, and it is expanding and climbing the value chain. Both sit offshore, so a location-based reading of the trend sees them cancel out. A work-based reading does not. Our claim is about the standardized production layer, which shrinks wherever it sits because AI absorbs the task, not because the work moves country.
This lever carries one real risk. If capability centers are already taking pricing strategy and HEOR ownership, they are also candidates for the oversight and judgment work we expect to stay onshore and nearshore. Nothing in the current evidence rules that out. What we would watch is whether validation, AI-governance and challenger language starts appearing in postings based in those hubs rather than in Europe and the US. If it does, the work is not returning to headquarters, it is being rebuilt offshore one level up, and the harder question becomes how to govern judgment at distance.
Where external vendors fit. The same logic applies to vendors as to hubs. Where the deliverable is specifiable, a model build, a literature review, a country dossier, an external partner can do it, and AI is compressing what that work is worth in the same way it is compressing offshore production30. What is not compressible is the reason companies buy externally in the first place: specialist methods the function will never need full-time, local market and payer knowledge in countries where it has no presence, and surge capacity around launch and JCA submission peaks. In-house capacity has not kept pace with that widening remit: BCG Roundtable benchmarking shows access resourcing broadly stabilizing since 2016, with growth in only about half of peer companies by 2022 and regional FTE levels split evenly between growth, decline and no change18. Scope has grown faster than headcount, and external reliance has grown with it37. The risk is the mirror image of the benefit. Work bought deliverable by deliverable fragments the evidence and value narrative across providers, and the institutional knowledge leaves when the contract ends. The design rule we apply: outsource the deliverable, never the accountability. Whoever will defend the submission to a payer or an HTA body must own the argument in-house, whatever the sourcing model behind it.
This reframes sourcing as a design choice rather than a cost afterthought:
- Onshore and nearshore: judgment calls, the strategic thinker and challenger role, payer- and HTA-facing relationships, JCA and cross-functional integration, AI oversight, proximity to local decision-makers.
- Offshore: the residual, purely standardizable production AI has not yet absorbed, shrinking over time on our reading rather than growing.
A note on “smaller and more senior.” It is tempting to read this as the onshore function simply shrinking. We don’t think that’s right: what changes is the type of work the function does, not necessarily its headcount. The role of the strategic thinker and challenger, the person who sets direction and pressure-tests a model or a submission rather than building it, is exactly the part that stays onshore as production moves elsewhere. Efficiency pressure is real: the BCG Roundtable’s benchmark records that centralizing technical evidence work can lift a company’s centralized-FTE share from as little as 15% to as much as 40%, alongside “improved efficiency in technical evidence activities like HE/HTA modeling”18, a point raised more than once in roundtable discussion. But efficiency shows up in output per person, not automatically in fewer people; the accurate framing here is ‘more senior,’ not ‘smaller’.
How this closes the Access Lag:
- Decide sourcing role by role and by design, not by habit or today’s cost table.
- Plan for the offshore share of production work to shrink over a two-to-three-year horizon as AI absorbs more of it directly, and build the AI-oversight and judgment competencies onshore and nearshore to match.
- Say “more senior,” not “smaller,” when you talk about the onshore function’s future: the evidence supports the first claim, not the second.
4. Lever 4: Strategic Market Focus, China and the emerging-market shift
How should pharma think about China in market access strategy? As a design choice tied directly to MFN’s reference-pricing mechanic, not a separate regional decision.
Country prioritization is no longer just a commercial growth decision. Increasingly, it is a downstream consequence of pricing-policy design. The mechanism is direct: MFN ties US prices to the lowest price paid across a reference basket of other developed markets, most of them European13, 14. A low negotiated price in a European launch no longer stays local: it becomes a candidate reference point for US pricing too, still the market that carries the largest share of global pharma revenue, at roughly half of worldwide prescription drug sales38.
This fourth lever’s trigger sits outside the four external forces in Figure 1: it is about where the organization chooses to compete, but the MFN mechanism above is exactly why it belongs in the response alongside the other three.
The rational response to that mechanism is more caution in Europe: slower, more selective launches, and pricing structures (confidential discounts, managed-entry agreements) designed to avoid setting a referenceable low list price. As European launch decisions get more guarded, the growth case for China and other markets outside the MFN reference basket strengthens, not because access there is easy (the National Reimbursement Drug List (NRDL) pressure below is real), but because it doesn’t carry the same direct US pricing consequence.
China’s 2025 NRDL negotiations added 114 new medicines, including 50 Class 1 innovative drugs, at an average price cut of over 60% for new listings29. A new Commercial Catalog launched alongside it, with 19 high-cost innovative drugs able to bypass standard NRDL price caps entirely29. China’s Basic Medical Insurance fund faces a projected deficit of roughly CN¥112 billion by 2030, and NRDL expert-review pass rates have already fallen from 62% in 2022 to 47% in 202428. Several multinationals, including the makers of Keytruda, Opdivo and Hemlibra, now bypass the standard NRDL route for high-value products, launching instead through City Supplementary Insurance and commercial health insurance, where price potential is higher28. Imported PD-1 inhibitors appear on neither the NRDL nor the new Commercial Catalog29.
For a market access operating model, this adds a fourth design question alongside remit, competencies and sourcing: how, and through which price architecture, does the organization prioritize China and other emerging markets without undermining the international reference pricing that MFN and other markets increasingly tie back to?
How this closes the Access Lag:
- Govern China and European launch sequencing as one connected decision, with the same cross-functional oversight as your other levers, not two separate regional calls: MFN’s reference-pricing mechanic ties them directly together.
- Decide deliberately between reimbursement-listing and commercial-channel launch paths: the price-architecture choice now has global reference-pricing consequences.
- Track China’s dual-catalog model as a template other price-sensitive markets may adopt next.
5. Redesigning the market access operating model: the Access Lag Framework’s four levers, one efficiency imperative
The four levers converge on one conclusion (Figure 1). A function needed earlier, owning more, requiring a different skill mix, sourced across a shifting onshore/nearshore/offshore/external line, and reprioritizing where it competes cannot be optimized by patching the existing structure job by job. It has to be redesigned as one operating model, with efficiency running through all four levers rather than bolted on as a fifth.
Why efficiency has to be explicit. In the BCG benchmark, access, policy and evidence leaders named governance and operational effectiveness as their top shared priority18. On the commercial side, Deloitte’s 2025 survey of 100 US biopharma leaders found 56% believe their function needs to change significantly or transform fully, and estimates generative AI alone could unlock up to $7 billion of value over five years, 25 to 35% of it in commercial functions12.
Market access excellence literature has long held the function rests on three pillars: organizational set-up, operational effectiveness and talent management11. Efficiency isn’t a new, fourth pillar. It’s what you get when the four levers are designed together instead of patched separately.
What this means in practice. We typically redesign the market access operating model across four levers, with efficiency built into each one rather than treated as a separate cost exercise:
- Remit & Timing: defining what access owns across development and launch, and at what stage market access gets a formal, binding voice in trial design, who adjudicates when that voice conflicts with medical or regulatory requirements, and what each function is measured on. Efficiency angle: fewer, clearer handoffs.
- Competency Mix: mapping capability gaps against the 2026 ISPOR framework and JCA requirements, domain by domain. Efficiency angle: the right skill sits in one place, not duplicated across teams.
- Sourcing Model: deciding, role by role, what stays onshore, what moves nearshore, and what AI now handles directly. Efficiency angle: speed and quality, not cost alone.
- Strategic Market Focus: deciding where, and through which price architecture, the organization competes hardest. Efficiency angle: one global pricing-governance view instead of market-by-market improvisation.
This is operating model redesign, not a hiring exercise. Fixing one lever without the other three reproduces the lag. A new competency model with no governance change still waits for permission to reach the trial-design table; a sourcing shift with no China or emerging-market strategy still improvises pricing architecture market by market. And a remit change that leaves each function’s incentives untouched grants a seat at the table without the authority to use it.
How this closes the Access Lag:
- Treat all four levers as one redesign, not four separate projects: efficiency is what you lose when you don’t.
- Sequence matters less than coverage: an operating-model redesign that skips one lever will re-create the lag within a product cycle.
- This is the point at which “still organized for 2024” becomes a governance and organization-design question, not a recruiting one.
6. The Access Lag Diagnostic: eight questions to test your operating model
Score your function against eight questions. They map directly onto the Access Lag Framework’s four levers: remit & timing, competency mix, sourcing model and strategic market focus.
- Does market access shape evidence and trial design at the phase the JCA now requires, or does it still receive the evidence package after the fact?
- Does the function own the outcome (access and adoption), or only the deliverables: the dossier, the model, the price?
- When market access and medical or regulatory disagree on the evidence plan, is it clear who decides, on what basis and by when, and do both functions’ performance measures support that decision rather than work against it?
- Assessed against the 2026 ISPOR framework and the JCA competency set, do you know where your gaps are per domain across access, HEOR and pricing?
- Is data-and-AI fluency a designed capability of the function, or a property of a few individuals?
- Is each role onshore, nearshore, offshore or with an external vendor by design rather than by habit, with a clear view of how that balance should shift as AI absorbs more production?
- Does your pricing and access strategy explicitly account for China and other emerging markets, or are they still an afterthought to US/EU launch sequencing?
- Does your current structure reflect the answers above, or the structure inherited from a narrower remit?
Two or more “no” answers mean the constraint is your market access operating model, not recruitment. Hiring against current job descriptions will reproduce the gap, one to two years behind the policy agenda.
7. How Vintura helps
Closing the Access Lag is an operating model question before it is a hiring question. As the opening of this article sets out, we see the same four recurring symptoms across our clients: unclear ownership, fragmented competencies, sourcing setups built for a pre-AI world and slow strategic reprioritization. Our work closes all four together.
In practice, that starts with benchmarking your function against the diagnostic above, then mapping competency gaps domain by domain against the 2026 requirements, and redesigning governance, sourcing and market prioritization as one connected decision, not four separate projects.
What this looks like in practice:
- A European organization had three country teams independently building indirect-treatment-comparison models for the same asset. Redesigning this into one shared, centrally governed evidence hub removed the duplication and gave country teams more time for payer engagement.
- A HEOR function ran AI pilots in three teams under three different validation standards. One governance standard, benchmarked against published criteria from the National Institute for Health and Care Excellence (NICE), turned AI disclosure from a submission risk into a credibility advantage.
- Hiring and promotion criteria in one HEOR function still rewarded model-building, even as the actual work had shifted to specifying, auditing and defending AI-built models. Redesigning career pathways and ways of working around that oversight role fixed what had looked like a retention problem but was actually a career-design problem.
- An RWE team delivered strong evidence under its integrated evidence generation plan (IEGP), but the findings rarely reached the people responsible for payer value communication. Connecting IEGP output directly to the value-communication workstream turned completed studies into arguments payers actually saw.
The evidence in this article is the starting point of that conversation. We would rather have it before the gap shows up in a JCA timeline, a retention problem mistaken for a hiring problem, or completed evidence that never reaches the people who need to communicate it.
Why we work on this. Vintura works on the operating model because that is the level at which these four gaps become solvable rather than merely manageable. Our interest in them is not only commercial. Each gap in this article ends, eventually, in a patient waiting. That is the reason we think it is worth getting right.
8. Frequently asked questions
What is a market access operating model?
It sets out who owns what, which capabilities the function needs, where the work is done and which markets the company competes hardest in, across access, HEOR and pricing. The definition box near the top gives the full version.
What does an effective market access operating model look like?
One where market access has a formal voice in trial design no later than the design of the pivotal trial, competencies are mapped against current ISPOR and JCA requirements, sourcing (onshore, nearshore, offshore, external vendors, AI-supported) is a deliberate design choice, and strategic market focus (including China and other emerging markets) is decided explicitly rather than by default. These are the four levers of the Access Lag Framework.
How should access, HEOR and pricing be structured?
Increasingly as one integrated function rather than three or four adjacent departments. Current vacancy data shows single roles now owning access strategy, pricing, HEOR/HTA and policy together. This kind of market access organization design is displacing the sequential, siloed model.
What capabilities are required for EU HTA and the Joint Clinical Assessment (JCA)?
The biggest addition is the ability to run regulatory and HTA evidence workstreams in parallel rather than in sequence, alongside PICO scoping and simulation. Indirect treatment comparison and its underlying statistics matter too, but are a smaller part of the shift. This is a new competency set, not an extension of existing HTA skills7, 9, 10.
Should market access work be onshored, nearshored, offshored or outsourced?
Judgment calls, payer- and HTA-facing relationships, and JCA/cross-functional integration work belong onshore or nearshore. External vendors are the right answer for capability a company does not need to own permanently: peak-load submission work, one-off country dossiers and specialist methods. Standardizable production, meaning model builds, literature synthesis and dossier drafting, is what AI is increasingly taking over directly, so it should not be the basis of a long-term vendor relationship.
How should pharma companies think about China and other emerging markets in market access strategy?
As an explicit fourth lever of the operating model, driven in part by MFN’s reference-pricing effect on European launches, not an afterthought to US/EU launch sequencing. China’s 2025 NRDL reforms cut prices by over 60% on average for new listings while opening a Commercial Catalog that lets some products bypass that pressure entirely, a price-architecture choice with consequences for global reference pricing28, 29.
What is the Access Lag Framework?
A Vintura framework with two parts: a diagnostic that measures how far a market access function’s remit, competencies, sourcing and strategic focus trail the external policy and technology agenda (typically one to two years), and four levers (remit & timing, competency mix, sourcing model, strategic market focus) used to redesign the operating model and close that gap, with efficiency running through all four.
Is generative AI now a baseline market access skill?
Yes. Current vacancy data shows AI and machine-learning tools listed alongside Excel and PowerPoint in market access job postings, and roughly one in seven roles on the specialist health economics job board carry an explicit AI/ML tag24.
9. Technical appendix: method and evidence base
This analysis draws on two independent evidence sources, so no single claim rests on one source alone. We examined what current job postings require, and separately, how the published competency literature has evolved over the same period. Where the two align, we treat the finding as well supported; where they diverge, we note it directly.
Stream A: vacancy analysis (three tiers)
- Sampling frame: EuropeanHealthEconomics.com (est. 2015), a specialist job board covering HEOR, market access, pricing and RWE globally, with a live population of roughly 370 to 430 roles in July 2026 snapshots. The public tier shows about 30% of listed roles with a seven-day delay; company career pages supplement depth coding24.
- Tier 1 (population tag counts, 13 July 2026): 56 roles tagged AI/ML/LLM (about 1 in 7) and 192 tagged RWE (about half), against 370 to 430 total. Census-level counts, not samples.
- Tier 2 (structural coding): 62 unique postings coded on title, employer, location, onshore/offshore, domain and seniority.
- Tier 3 (depth coding): 33 postings coded on full requirement text. Claims requiring full text, such as the MFN-absence finding, rest on this tier only.
- Historical baseline: direct retrieval of five-year-old posting text proved unreliable (modern applicant-tracking systems render text via JavaScript the Internet Archive does not capture). We anchor the historical baseline instead on the 2020 ISPOR HEOR Competencies Framework, itself derived partly from natural language processing (NLP) analysis of ISPOR Career Center postings from that era1. This is a comparison against a validated posting-derived baseline, not an anecdote. It also means the flagship competency framework in this field was itself built by analyzing job postings, so the method here follows an accepted precedent rather than inventing one. ISPOR states that the framework is intended in part to help hiring managers set competency benchmarks in job adverts, which is precisely the comparison we are making2, 3.
Stream B: competency literature (5 to 10 years ago vs. last 2 years)
- Earlier corpus (~2015 to 2020): the 2020 ISPOR framework1; the 2018 Simon-Kucher organizational account11; early payer-integration literature23.
- Recent corpus (2024 to 2026): the February 2026 ISPOR update2, 3; the ISPOR generative-AI taxonomy4; the ISPOR 2026-2027 Top 10 Trends report5; JCA-readiness literature7, 8, 9, 10; the US pricing-policy record on MFN and the IRA13, 14, 15, 16; value-based contracting12, 17; lifecycle evidence-demand literature25, 26, 27; the BCG Market Access Roundtable benchmark18, 19, 20; and China market-access analysis28, 29.
- Congress analysis: ISPOR Europe and World EPA Congress programs, coded 2019 to 2026, as a proxy for agenda shift.
What we coded for, in short: which domain a source addressed (Access/HEOR/Pricing); how senior the role was; whether AI or automation was required and how explicitly; how much statistical/data-science depth was asked for; whether EU HTA/JCA appeared; how much pricing-policy literacy was expected; how far roles had merged across domains; and whether the role was based onshore or offshore.
Limitations
- Our depth-coded sample (33 postings) is large enough to see a direction, not to put a precise number on its size.
- No archive of 2020 postings exists, so the baseline is the competency framework built from them. The comparison is between the framework and the vacancy, not between similar things.
- Our structural sample comes from the job board’s free public tier, which shows about 30% of listings with a delay; the population-level tag counts, by contrast, cover the whole board.
- Job boards tend to over-represent consultancies and larger employers relative to smaller biotechs.
- Published competency frameworks and congress programs move by committee, so they lag live market demand. This makes our “one-to-two-year lag” estimate conservative, not inflated.
- Read the one-to-two-year figure as a central estimate, not a precise measurement. Measured event by event against the competency literature, the gap ranges from about 13 months for JCA to over three years for AI, and was still open for MFN as of August 2026.
- The Lever 3 sourcing shift (AI directly displacing offshore production) is our forward-looking reading of the trend, not yet an outcome visible in this year’s postings. Treat it as a prediction to test against next year’s vacancy data, not a present-tense finding.
What would settle it. We are stating the test now, before the result is known, so the claim can be held to it. Repeating this method in July 2027 and July 2028 would support the reading if offshore production postings fall as a share of the sample while the absolute count of onshore and nearshore postings carrying oversight, validation or AI-governance language rises. It would weaken the reading if offshore production postings hold flat or grow while AI language spreads through them, which would indicate AI being absorbed inside the offshore layer rather than replacing it. It would refute the reading if oversight and AI-governance language appears mainly in postings based in offshore hubs. It would be uninformative if total postings fall everywhere, since a hiring-cycle contraction cannot be separated from a sourcing shift on this data alone.
Reference 24 is Vintura’s own primary data; named employers cited against it are observations from that sample. All other references are external sources, cited to primary sources where available; see the reference-by-reference verification notes below.
10. Sources
- Pizzi LT, Onukwugha E, Corey R, Albarmawi H, Murray J. Competencies for Professionals in Health Economics and Outcomes Research: The ISPOR HEOR Competencies Framework. Value in Health. 2020;23(9):1120-1127. doi:10.1016/j.jval.2020.04.1834.
- ISPOR. ISPOR Publishes Health Economics and Outcomes Research Competencies Framework. News release, 17 February 2026.
- ISPOR. HEOR Competencies Framework (resource page). ispor.org/heor-resources/heor-competencies-framework.
- Fleurence RL, Wang X, Bian J, et al. A taxonomy of generative artificial intelligence in health economics and outcomes research: an ISPOR Working Group report. Value in Health. 2025;28(11):1601-1610.
- ISPOR. ISPOR 2026-2027 Top 10 HEOR Trends Report. Sixth biennial edition, published 20 January 2026. AI rose from third to first; RWE second; drug pricing fourth.
- Flatiron Health. ISPOR 2026 reflections: AI, access, and the evolving role of RWE in oncology. Published after the ISPOR 2026 annual meeting, 2026.
- Parexel. Navigating the Joint Clinical Assessment (JCA) implementation: an analysis of EU member states’ readiness, challenges and opportunities for harmonization. January 2025.
- DIA Global Forum. EU HTA Regulation Joint Clinical Assessments: Ready for January 2025? August 2024. Report of the DIA Europe 2024 HTA Townhall. The panel comprised the European Commission, EMA, TLV (HTACG co-chair for medicinal products), HAS (chair of the HTACG JCA subgroup), the European Patients’ Forum, Bayer and the EFPIA HTA Working Group.
- Trinity Life Sciences. Joint Clinical Assessment in the EU: What Life Sciences Companies Need to Know. June 2025.
- European Commission. Regulation on Health Technology Assessment (HTAR), official regulation page: health.ec.europa.eu/health-technology-assessment/regulation-health-technology-assessment_en. Procedural detail on joint clinical assessments and joint scientific consultations sits under the implementation section of the same portal.
- Simon-Kucher & Partners. Pharmaceutical Industry: Organization of the Pricing and Market Access Function. 2018.
- Fox J, Elsner N, Jobanputra D. Navigating the future of commercial in biopharma. Deloitte Insights, 3 June 2025. Survey of 100 US biopharma commercial leaders plus 12 executive interviews, November 2024.
- The White House. Executive Order 14297: Delivering Most-Favored-Nation Prescription Drug Pricing to American Patients. 12 May 2025.
- US Department of Health and Human Services. HHS, CMS Set Most-Favored-Nation Pricing Targets to End Global Freeloading on American Patients. Press release, 20 May 2025.
- The White House. Fact Sheet: President Donald J. Trump Announces Largest Developments to Date in Bringing Most-Favored-Nation Pricing to American Patients. 19 December 2025. Records 14 manufacturer agreements since 30 September 2025.
- Mintz. Mintz IRA Update, Under Pressure: The Trump Administration’s Drug Pricing Executive Orders. September 2025. Confirms continuation of the Medicare Drug Price Negotiation Program and maximum fair prices.
- Centers for Medicare & Medicaid Services. Cell and Gene Therapy (CGT) Access Model. cms.gov/priorities/innovation/innovation-models/cgt. First federal negotiation of outcomes-based agreements with manufacturers on behalf of state Medicaid agencies; key terms agreed with the two sickle-cell gene-therapy manufacturers in December 2024, states participating from January 2025.
- Hochstrasser M, Grueger J, de Gorgolas M, Vaidyanathan S (Boston Consulting Group, BCG Market Access Roundtable). A New Era for Market Access: Organizing the Function’s Broader Strategic Role. PharmExec 2023;43(5), May 2023. Reports the 2022 benchmark, the fourth since 2013. As at August 2026 no fifth benchmark had been published; the Roundtable’s most recent output (August 2025) addresses evidence generation rather than functional organization. Benchmark of 14 pharmaceutical companies, over 150 interviews and around 500 survey responses; roundtable benchmarks run every three years since 2013.
- BCG Market Access Roundtable. A Cross-Functional Formula: Operationalizing the Broader Role of Access. PharmExec, August 2022.
- BCG Market Access Roundtable. A Framework for Future: Strengthening Market Access Competencies. PharmExec, August 2021.
- Corvino B, Elsner N, Wagh M, Jaeger J. Rethinking market access. Deloitte Insights, March 2022, updated April 2025.
- Ralston S, interviewed by Rahman L. Market access: understanding trends and challenges. Drug Discovery World, 18 July 2025. Interview with the EVP Market Access and HEOR at Coronado Research; a single practitioner view, not a survey.
- Gaebler JA. Integrating the Payer Perspective into Pharmaceutical Drug Development. Clinical Leader, 2017; Galante D. The Evolving Reimbursement Landscape: Considerations for Clinical Trial Design. Clinical Leader, 2018.
- Vintura primary data, July 2026. (a) Population-level tag counts from EuropeanHealthEconomics.com captured 13 July 2026: 56 AI/ML/LLM-tagged roles and 192 RWE-tagged roles against a listed population of roughly 370 to 430. (b) Structural sample: 62 unique current postings coded on title, employer, location, onshore/offshore, domain and seniority. (c) Depth-coded sample: 33 postings coded on full requirement text. (d) Congress-program analysis: ISPOR Europe and World EPA Congress programs, 2019 to 2026.
- Grueger J, Andre N, Vaidyanathan S. The Future of Integrated Evidence Planning in Biopharma. Boston Consulting Group, April 2023.
- Hamlin A. Right-sizing your approach to market access in early clinical development. Avalere Health, November 2023.
- Bower D, Wiśniowska A. Evolving a Market Access Strategy to Improve Patient Access. PharmExec, April 2021.
- Hooton J, Yang FC, Kong D. China, a critical yet complex market for access: key considerations for national and subnational success. IQVIA, 5 December 2025. Source of the projected ¥112 billion BMI fund deficit by 2030 and of the fall in NRDL expert-review pass rates from 62% (2022) to 47% (2024).
- Greenberg Traurig LLP. China on the Move: Key Takeaways from the 2025 NRDL Negotiations and Adjustment. February 2026.
- Capgemini. Press release: Capgemini completes the acquisition of WNS and creates a global leader in Agentic AI-powered Intelligent Operations. 17 October 2025. Transaction announced 7 July 2025 and completed 17 October 2025 for cash consideration of 3.3 billion US dollars; Capgemini states the rationale as the shift from traditional business process services to AI-powered intelligent operations. See also WNS (Holdings) Ltd, Form 8-K filed with the US Securities and Exchange Commission, 2025.
- The White House. Fact sheets on Most-Favored-Nation manufacturer agreements, September 2025 to April 2026. The 17th agreement, announced 23 April 2026, completed the set of manufacturers that received letters on 31 July 2025.
- ZS. The state of pharma commercial services in India-based global capability centers. July 2025. Reports roughly 2.5 times growth in pharma commercial services scale over five years, and names portfolio analytics, forecasting, pricing strategy and HEOR as areas set for deeper ownership.
- Sanofi Healthcare India. Press release: expansion of the Hyderabad Global Capability Center. 16 February 2026. Planned capacity raised from approximately 2,600 to approximately 4,500 employees.
- EFPIA. Patients W.A.I.T. Indicator, 2025 study, published 19 May 2026. Analysis of 168 medicines granted central marketing authorization between 2021 and 2024 across 36 countries, prepared with IQVIA. Median time to availability 532 days. EFPIA is the European pharmaceutical industry association and publishes the indicator in the context of its own policy positions; the underlying country-level data and method are set out in the report.
- Post HC, Schutte T, van Oijen MGH, van Laarhoven HWM, Hollak CEM. Time to reimbursement of novel anticancer drugs in Europe: a case study of seven European countries. ESMO Open. 2023;8(2):101208. doi:10.1016/j.esmoop.2023.101208. Sample of 35 medicines, pooled median time to reimbursement 407 days; clinical benefit scored on ESMO-MCBS v1.1 was tested as a candidate factor.
- Patient Access Challenges Are Changing Pharma Investment Strategies. Life Science Leader, 2024. Reports survey findings that 87% of pharmaceutical companies now begin market access planning before Phase 3, with some starting as early as Phase 1, indicating that Phase 3 was the historical entry point for payer input.
- Market access: understanding trends and challenges. Drug Discovery World, July 2025. Trade-press account reporting organizational change at large pharmaceutical companies and greater reliance on external market access partners. Its claim that in-house teams have been reduced is not corroborated by the BCG Roundtable benchmark18, which shows resourcing broadly stable; cited here for the growth in external reliance only.
- IQVIA data on national pharmaceutical market size, 2024 (as compiled by Statista, largest pharmaceutical markets by sales). The United States accounted for approximately half of worldwide prescription drug sales in 2024, around USD 800bn of an estimated USD 1.7tn global market, ahead of China, Germany, Japan and France. Figures are ex-manufacturer list prices and do not reflect US rebates, so the net US share is lower.
- Charles River Associates for EFPIA. European Access Hurdles Portal: results from the fourth year of data collection, May 2026. Covers 91 centrally authorized medicines approved between January 2022 and June 2025, on average 27 months past authorization, across 30 European countries, with data from all 35 EFPIA member companies holding eligible products. Average filing rate for pricing and reimbursement 61%, of which 53% reimbursed, 41% pending and 6% refused or withdrawn. Economic viability is the largest group of reasons given for not filing, counted after responses recorded as “other” are set aside, as the report does. Industry-funded and published alongside EFPIA’s own policy positions; method and caveats are set out in the report.
- Nakai K. Japan’s Pharmaceutical Regulatory Reform to Overcome Drug Loss Issue. Therapeutic Innovation & Regulatory Science 2026;60(3):612-616, published online 14 February 2026. Source of the count of 86 medicines approved in Europe and the United States for which development had not begun in Japan, of which 48 (56%) came from venture companies, 40 (47%) were orphan drugs and 32 (37%) were paediatric. The author works for Japan’s Ministry of Health, Labour and Welfare, so the paper is a regulator’s account of its own reform program. The figure of 82 as of March 2024 is from Japan Pharmaceutical Manufacturers Association data as reported by the Tokyo Foundation, Addressing Japan’s drug loss and drug lag, 2024. The comparison of 52% against 19% is from Kobayashi M, Narukawa M. Drug Loss in Japan: A Comparative Analysis with Europe for New Drugs Developed by Emerging Biopharma Companies. Clinical Pharmacology & Therapeutics 2026;119(5):1249-1256, doi:10.1002/cpt.70001; the corresponding author is employed by a pharmaceutical manufacturer.
- Centers for Medicare & Medicaid Services. Global Benchmark for Efficient Drug Pricing (GLOBE) Model and Guarding U.S. Medicare Against Rising Drug Costs (GUARD) Model, proposed rules published in the Federal Register on 23 December 2025; comments closed 23 February 2026, proposed start dates 1 October 2026 (GLOBE) and 1 January 2027 (GUARD). The GLOBE final rule was published in the Federal Register on 2 October 2026; GUARD had not been finalized at the time of writing. For the April 2026 Executive Order linking tariff relief to MFN and domestic-production commitments, and for the state of congressional scrutiny, see Sidley Austin LLP, Most-Favored-Nation Drug Pricing Policy: Executive Actions, Manufacturer Agreements, and Growing Congressional Scrutiny, 22 April 2026 (note that this alert gives different expansions of the GLOBE and GUARD acronyms from the Federal Register; the Federal Register titles are used here). For the distinction between terms applying to future launches and terms for products already marketed, see The White House, Savings from Most-Favored-Nation Drug Pricing Policy, May 2026, a government assessment of the government’s own policy. TrumpRx opened on 5 February 2026.
- European Medicines Agency. Real-world evidence framework to support EU regulatory decision-making: 4th report on the experience gained with regulator-led studies from February 2025 to February 2026. EMA/66577/2026.
Reference-verification note. Every source above was checked against its original publication before this version was finalized. Reference 24 is Vintura’s own primary research and is not externally verifiable by design.
11. About the authors
Bas Amesz is Managing Partner at Vintura and has more than 25 years of experience advising pharmaceutical and biotech companies on market access and healthcare strategy.
He specializes in market access operating models, organizational transformation and stakeholder engagement. His work helps organizations turn strategy into sustainable access outcomes.
Ann-Sophie Kuschel is Principal Consultant at Vintura. She has more than 10 years of experience advising pharmaceutical, biotech and medtech companies on market access and healthcare strategy.
She specializes in market access transformation, organizational design, clinical development and value communication. Ann-Sophie holds a PhD in Pharmaceutical Sciences from the University of Tübingen.
www.linkedin.com/in/ann-sophie-kuschel/
Contact
Bas Amesz · bamesz@vintura.com · www.vintura.com
Ann-Sophie Kuschel · askuschel@vintura.com · www.vintura.com
Suggested citation
Amesz, B. and Kuschel, A.-S. (2026). Still Organized for 2024? Why the market access operating model needs redesigning, and how the Access Lag Framework closes the gap. Vintura.
Disclaimer. This paper sets out the authors’ analysis and opinion and is intended to inform professional debate. It does not constitute legal, regulatory, financial or investment advice, and Vintura accepts no liability for decisions taken on the basis of it.
A note on timing. The policy and market access environment described here is changing rapidly. The analysis reflects developments known as of October 2026, and some elements are likely to be overtaken by later events.
© 2026 Vintura. All rights reserved. You are welcome to quote from or share this paper for non-commercial purposes, provided Vintura and the authors are credited.